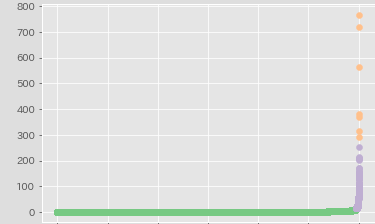
いつものHML分析
d = access_features['count'].sort_values().reset_index()
d.columns = ['base_index', 'count']
d = d.reset_index()

from sklearn.cluster import KMeans
from matplotlib import cm
kmeans = KMeans(n_clusters=3)
kmeans.fit(d[['count']])
d.loc[:, 'cluster'] = kmeans.labels_

fig, ax = plt.subplots()
colors = cm.Accent.colors
for i in range(3):
    target = d[d['cluster'] == i]
    ax.scatter(x=target['index'], y=target['count'], c=colors[i]
